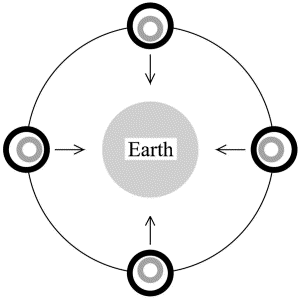
Fig. 1. Section across the spin/symmetry axis of the GG outer and inner test cylinders (of different composition) as they orbit around the Earth inside a co-rotating, passively stabilized spacecraft (not shown). The centers of mass of the test cylinders are shown to be displaced towards the center of the Earth as in the case of a violation of the equivalence principle in the field of the Earth (indicated by the arrows). The signal is modulated at the spin frequency of the system (2 Hz with respect to the center of the Earth). The figure is not to scale (taken from Nobili et al., 2001).
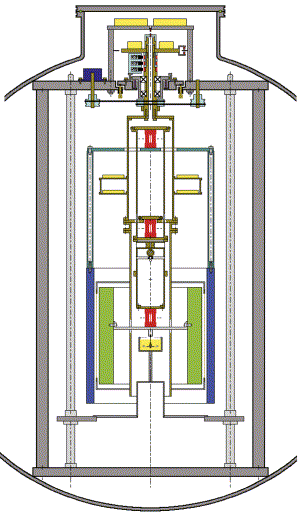
Fig. 2. Section through the spin axis of the differential accelerometer inside the vacuum chamber (drawing to scale; inner diameter of vacuum chamber 1 m; see text for a description of its parts).
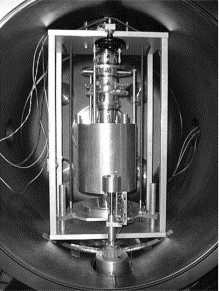
Fig. 3. The rotating differential accelerometer mounted inside the vacuum chamber (in the basement of the LABEN laboratories in Florence).
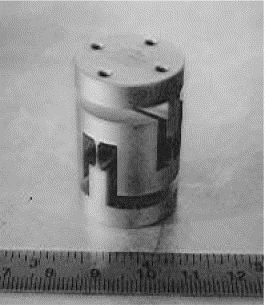
Fig. 4. One of the three laminar suspensions used in the accelerometer (sketched in red in Fig. 2). They are carved out of a solid bar of CuBe by electroerosion in 3D and properly treated for high mechanical quality.
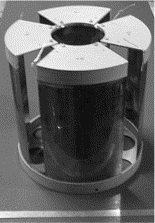
Fig. 5. The four capacitance plates (with their insulating frames) forming the two capacitance bridges of the read-out. They are mounted halfway in between the concentric test cylinders to read their relative displacements (see section in Fig. 2).
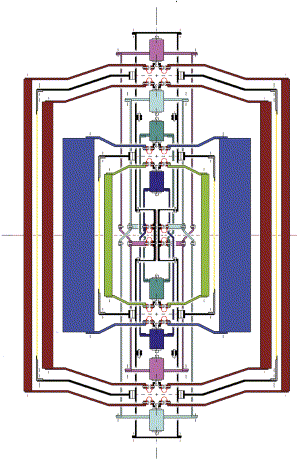
Fig. 6. Section through the spin axis of the differential accelerometers of the proposed GG mission for testing the equivalence principle in low Earth orbit. There are four test cylinders (10 kg each), one inside the other, all centered at the same point (nominally, the center of mass of the spacecraft) forming two differential accelerometers: the inner one for EP testing (cylinders of different composition; shown in green and blue respectively) and the outer one for zero check (cylinders made of the same material; both shown in brown). In each accelerometer the two test cylinders are coupled to form a beam balance by being suspended at their top and bottom from the two ends of a coupling arm made of two concentric tubes (each tube suspends one test cylinder at each end, which makes it asymmetric top/down; however, the two of them together form a symmetric coupling). All four tubes (two for each coupling arm) are suspended at their midpoints from the same suspension shaft (the longest vertical tube in figure). In all cases the suspensions are
-shape (or
-shape) thin strips (shown in red), to be carved out of a solid piece of CuBe. At each connection there are three of them, at 120° from one another (the planar section in figure shows two for explanatory purposes only). There are capacitance plates (connected to the suspension shaft) for the read-out of differential displacements in between each pair of test cylinders (shown as yellow lines in section).The eight small cylinders drawn along the symmetry axis are inchworms for the fine adjustment of the lengths of the coupling arms in order to center each test mass on the center of mass of the spacecraft. The whole system is symmetric around the spin axis as well as top/down. The two accelerometers are both centered at the center of mass of the spacecraft in order to reduce common mode tidal effects and improve the reliability of the zero check.
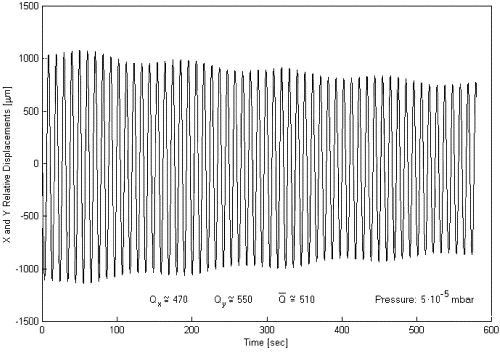
Fig. 7. Relative displacements, in the X and Y directions of the sensitivity plane, between the centers of mass of the test cylinders at zero spin rate. The natural periods of differential oscillations at 11 s are apparent. The amplitudes of these oscillations are slowly decreasing with time, yielding a quality factor of about 510 (taken from Nobili et al., 2000).
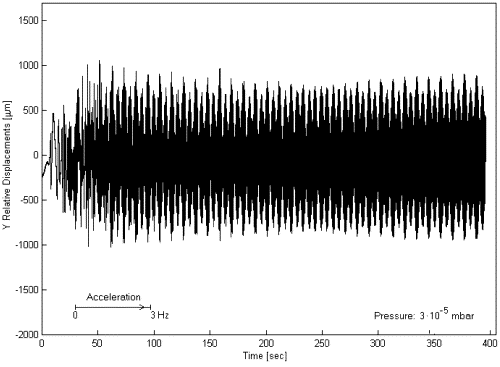
Fig. 8. Relative displacements (for the Y direction only, in the rotating reference frame) obtained with the same instrument as in Fig. 7 but having brought it to a rotation rate of 3 Hz. The natural differential oscillation at about 11 s period (the same as at zero spin) is apparent, as it is the faster rotation frequency of the system at 3 Hz.
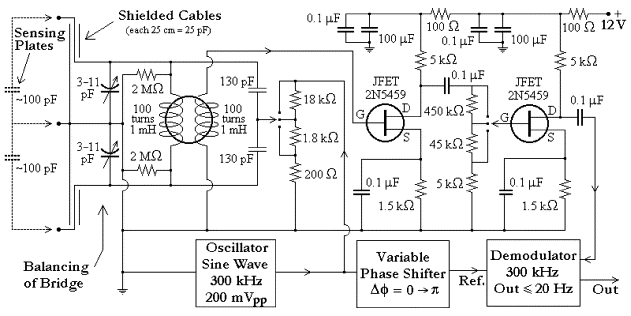
Fig. 9. The capacitance bridge sensor circuits used in the accelerometer of Figs. 2 and 3 for the read-out of the relative displacements of the test cylinders.
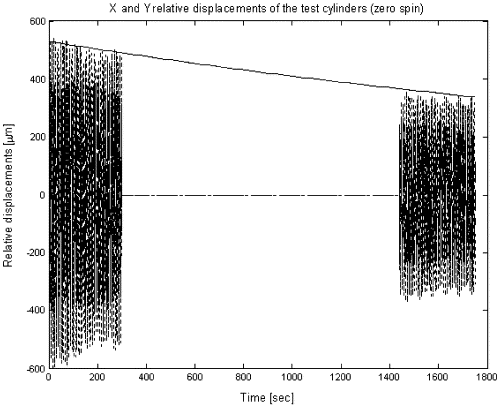
Fig. 10. Relative displacements, in the X and Y directions of the sensitivity plane, between the centers of mass of the test cylinders at zero spin rate. The natural periods of differential oscillations are of about 8 s. The amplitudes of these oscillations are slowly decreasing with time; data sets taken at subsequent times
under no changes in the system
yield a quality factor of about 1590. Residual air pressure during this measurement is of 2·10
5 mbar.
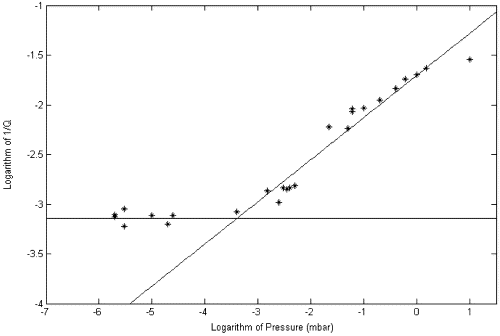
Fig. 11. Log-Log plot of the 1/Q value of the natural differential oscillations (
8 s period), at zero spin rate, as function of the residual air pressure in the chamber with linear best fits to the two sets of data, above and below 10
3 mbar. Each point refers to a separate run. For pressures greater than about 10
3 mbar the value of Q decreases as pressure increases. For lower pressures the value of Q reaches about 1590 and is then independent of pressure since it is the maximum value allowed by losses in the laminar suspensions.
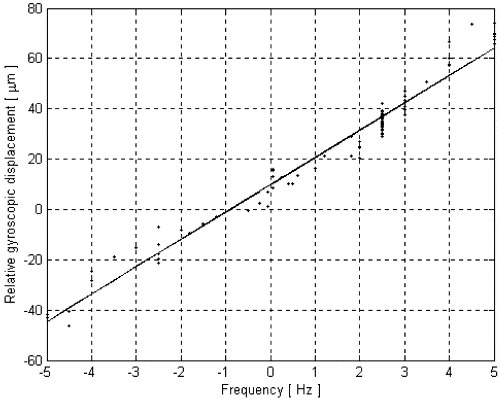
Fig. 12. Relative displacements (crosses) of the test cylinders, fixed in the horizontal plane of the laboratory, as function of the spin frequency and the sense of rotation, with linear fit to a straight line (on the frequency axis, counterclockwise spin frequencies are indicated as positive, clockwise ones as negative). The linear increase with the spin rate and the change of sign can be ascribed to the gyroscopic effect. The offset at zero spin is due to the inclination of the suspension shaft from the vertical.
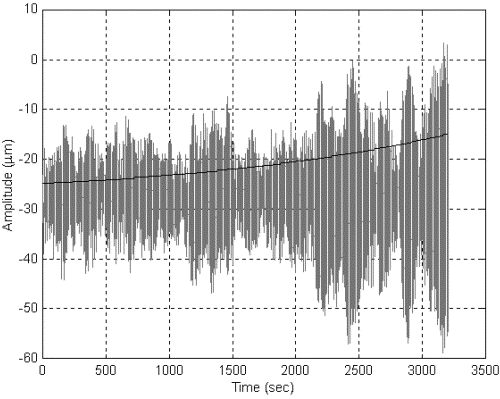
Fig. 13. Amplitude of the relative displacements between the test cylinders once transformed in the non-rotating plane of the laboratory (at a spin rate of 2.5 Hz). The growth in oscillation amplitude is due to an undamped whirl motion at 0.74 Hz. Its growth is represented by the exponential curve, and is due to losses in the system (at the spin frequency) corresponding to a Q value of 4900.
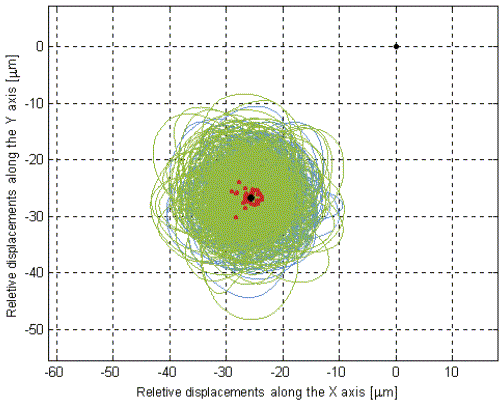
Fig. 14. Relative displacements of the test cylinders in the horizontal (non-rotating) plane of the laboratory with the accelerometer spinning at 2.5 Hz (counterclockwise). The position of relative equilibrium (the black dot at the middle of the figure) is displaced towards South (in this plot North is at 45°, i.e. in the +X, +Y direction) because of the gyroscopic effect and short periodic relative motions occur around it. Average over the differential whirl period gives the red dots from whose average the black dot is obtained, thus defining the relative equilibrium vector for this data set (lasting 660 s) of a run lasting about 1 h.