In this Section we report the results obtained during several months of operation of the rotating differential accelerometer as outlined above, with only two relevant natural frequencies. The results concern the quality factor of the system (at the natural differential frequency and at the spin frequency), the differential gyroscopic effect, the growth rate of whirl motion and the stability in time of the differential displacement vector between the test cylinders.
Fig. 10 shows the differential oscillations of the test cylinders in the X and Y directions (at about 8 s; zero spin rate). The slow decay in the oscillation amplitudes yields a Q value of 1590. This value has been obtained in vacuum with a residual air pressure of 2·10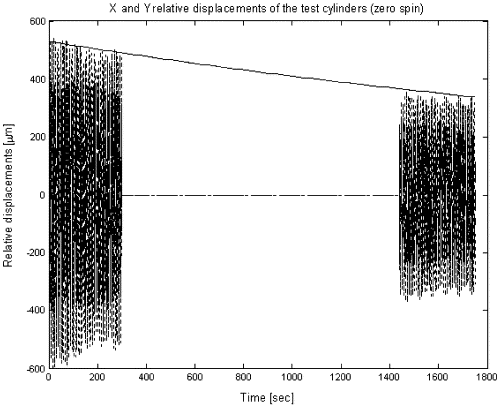
Fig. 10. Relative displacements, in the X and Y directions of the sensitivity plane, between the centers of mass of the test cylinders at zero spin rate. The natural periods of differential oscillations are of about 8 s. The amplitudes of these oscillations are slowly decreasing with time; data sets taken at subsequent times
under no changes in the system
5 mbar.
By performing Q measurements at different pressures it was possible to establish
that residual air in between the test cylinders gives rise to dissipation. Losses due to
air friction linearly decrease with pressure until they remain constant and no longer
depend on the decreasing pressure (below a few 10![]() 5 mbar). Fig.
11 shows well this phenomenon and indicates that, as long as the system is operated at
sufficiently low pressure, losses depend on the laminar suspensions only. Note that Q=1590,
as from Fig. 10 for oscillations at
5 mbar). Fig.
11 shows well this phenomenon and indicates that, as long as the system is operated at
sufficiently low pressure, losses depend on the laminar suspensions only. Note that Q=1590,
as from Fig. 10 for oscillations at ![]() 8 s, is about three times
better than the Q value previously obtained (at 11 s; see Fig.
7).
8 s, is about three times
better than the Q value previously obtained (at 11 s; see Fig.
7).
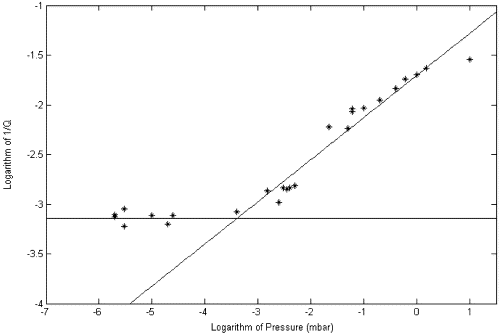
Fig. 11. Log-Log plot of the 1/Q value of the natural differential oscillations (
8 s period), at zero spin rate, as function of the residual air pressure in the chamber with linear best fits to the two sets of data, above and below 10
It is very important to check that gyroscopic effects are as theoretically expected. For this reason numerous measurements have been performed, at various spin frequencies both in clockwise and counterclockwise rotation. Relative gyroscopic displacements of the test cylinders are expected in the North-South direction of the horizontal plane of the laboratory (towards South for counterclockwise rotation, towards North for clockwise rotation), and the amount of the displacement should increase linearly with the spin rate. Measurements reported in Fig. 12 (with a fit to a straight line) show agreement with the theoretical predictions. Each data point in the plot has been obtained from the raw data of the capacitance bridges (in the rotating reference frame) acquired as discussed in Section 4, by coordinate transformation to the non-spinning laboratory frame (see Section 4) and after averaging out of short periodic variations.
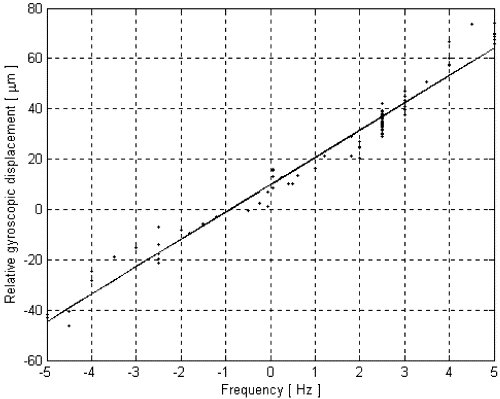
Fig. 12. Relative displacements (crosses) of the test cylinders, fixed in the horizontal plane of the laboratory, as function of the spin frequency and the sense of rotation, with linear fit to a straight line (on the frequency axis, counterclockwise spin frequencies are indicated as positive, clockwise ones as negative). The linear increase with the spin rate and the change of sign can be ascribed to the gyroscopic effect. The offset at zero spin is due to the inclination of the suspension shaft from the vertical.
The fit is good, but the amount of the displacement is higher than originally expected. The disagreement is explained once the effect is calculated taking into account that the laminar suspension of the inner test cylinder (at the bottom end of the coupling arm) had been replaced by a solid brass cylinder connecting it to the lower half of the coupling arm, suspended from the central laminar suspension. At any given spin rate the relative gyroscopic displacement of the test cylinders, plus any original deviation of the suspension shaft from the local vertical, produce a relative displacement vector fixed in the non-spinning reference frame of the laboratory. Any smaller, slowly changing differential effect must be detected as an additional relative vector moving around this fixed displacement. The smaller the deviation from a fixed displacement, the more sensitive is the accelerometer to low frequency differential effects (such as the one due to an EP violation in the field of the Sun, with a 24-h period). The fixed displacement can be subtracted away during data analysis; however, once the nominal spin rate has been chosen, the verticality of the suspension shaft (in the laboratory frame) can be adjusted (as discussed in Section 3) so as to compensate for the gyroscopic effect at the working spin rate.
Although whirl motions at the natural frequencies can be damped, it is very important to know how rapidly they grow, i.e. how strong are the destabilizing forces (due to losses in the suspensions at the spin frequency) which need to be counteracted. It is apparent that, the slower is the growth rate of whirl motions, the easier it is to stabilize the system, the smaller are the perturbations caused by the required damping on the signal of interest (Nobili et al., 1999).
We have therefore performed long runs (up to several hours) with the accelerometer spinning at a few Hz and no damping applied (neither passive nor active). Pressure in the chamber was low enough to rule out any dissipation due to residual air (see Fig. 11) and data from the capacitance bridge sensors were taken continuously in order to monitor the growth of oscillation amplitudes (whirl motions at the natural frequencies in the laboratory frame show up as oscillations close to the spin frequency in the reading of the X and Y relative displacements of the test cylinders by the rotating capacitance bridges). We have runs of 3.5 h in which no appreciable growth in the oscillation amplitude could be detected. A shorter run is shown in Fig. 13 (at a spin rate of 2.5 Hz), in which the oscillation amplitude of an undamped whirl motion at 0.74 Hz shows a growth corresponding to a (negative) Q of 4900, which is therefore (with the positive sign) the quality factor of the system at the frequency of spin. We can compare it to a Q of about 2000 measured for the laminar suspension only (Fig. 4), by setting it in oscillation at 5 Hz and monitoring the decay with time of the oscillation amplitude. The measurement was performed for horizontal oscillation only, for the measured Q not to be affected by local gravity; the amplitude of the oscillations was much larger ("GALILEO GALILEI" (GG), Phase A Report, 1998, Section 3.4; Nobili et al., 2000).
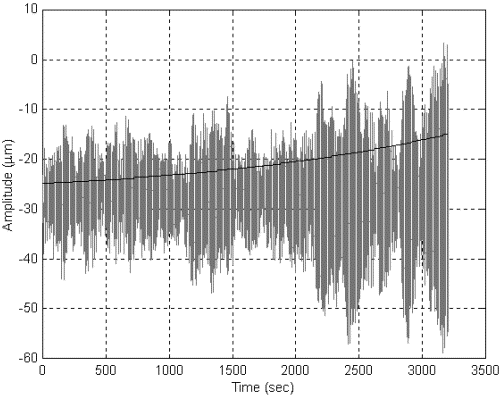
Fig. 13. Amplitude of the relative displacements between the test cylinders once transformed in the non-rotating plane of the laboratory (at a spin rate of 2.5 Hz). The growth in oscillation amplitude is due to an undamped whirl motion at 0.74 Hz. Its growth is represented by the exponential curve, and is due to losses in the system (at the spin frequency) corresponding to a Q value of 4900.
The relevant physical quantity which remains to be measured is the stability in time of the relative position of the test cylinders in the horizontal plane of the laboratory, non-rotating, frame after short periodic effects have been filtered out. Fig. 14 gives an example. It shows, for a run at 2.5 Hz, the relative displacements of the test cylinders in the horizontal plane of the laboratory after coordinate transformation of the capacitance bridges measurements from the rotating reference frame to the non-rotating one. The curve gives the relative motion as time goes by, roughly represented with color: from blue at the beginning to green at the end of the run. The motion occurs away from the origin (zero relative displacement), around an equilibrium position vector (vector head plotted as a black dot) dominated by the gyroscopic effect (towards the South of the laboratory plane in this case because the accelerometer spins counterclockwise). This equilibrium vector is computed as the average of the vectors (whose heads are plotted as red dots), which are obtained from the average over the whirl period (3.5 s at 2.5 Hz spin frequency; the decrease from the value of the differential period observed at zero spin, shown in Fig. 10, is due to the inner test cylinder being rigidly connected to the bottom end of the coupling arm, as pointed out in Section 2). By performing a continuous run of measurements, with the accelerometer spinning at a given spin rate, we can compute, for various data sets of the same run, the coordinates of the black dot, and check its stability in time. The more stable it is, the better is the instrument sensitivity. The best result obtained so far is a stability of 1.5 µm in 1 h (at a spin rate of 2.5 Hz).
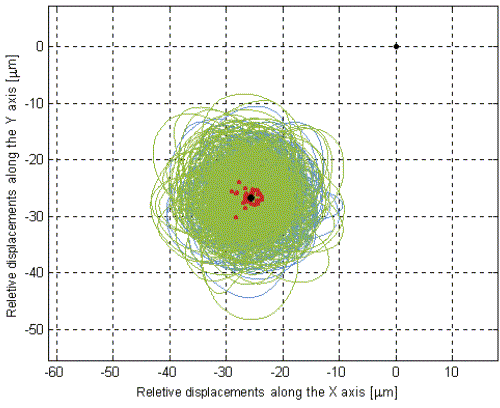
Fig. 14. Relative displacements of the test cylinders in the horizontal (non-rotating) plane of the laboratory with the accelerometer spinning at 2.5 Hz (counterclockwise). The position of relative equilibrium (the black dot at the middle of the figure) is displaced towards South (in this plot North is at 45°, i.e. in the +X, +Y direction) because of the gyroscopic effect and short periodic relative motions occur around it. Average over the differential whirl period gives the red dots from whose average the black dot is obtained, thus defining the relative equilibrium vector for this data set (lasting 660 s) of a run lasting about 1 h.
It is worth stressing that the large perturbations that give rise to these displacements are not unexpected: they are due to the motor, to the ball bearings, to the non-perfect verticality of the system, all causes that will be absent in the space experiment. Firstly, because in the space experiment there is no motor (once the spacecraft has been brought to the desired rotation speed by small tangential jets, these jets can be completely turned off). Then, because there are no bearings, since the whole spacecraft rotates with all its parts at the same rotational speed. Then, because the direction of the rotation axis is not critical, since there is no 1-g force of gravity to withstand. Other perturbations, such as terrain tilts and microseisms, are by far more relevant for the ground prototype than it is residual vibration noise inside the spacecraft. The only perturbations on the ground that have a corresponding perturbation in space, in addition to thermal noise, are the slow whirling instabilities which, according to the measurements reported above, do not appear to be the limiting factor to the observed stability of the relative position of the test cylinders. There is therefore no physical reason to expect that the same perturbations, or other perturbations as large as these, will act on the planned space experiment.